
How Long Do GPUs Last Anyway? A Look Into Hyperscalers' Depreciation Policies, GPUaaS Unit Economics
Why skeptics of the hyperscalers’ depreciation policies are likely wrong, and why GPUaaS unit economics are quite attractive even for legacy GPUs


Valuation multiples of the US hyperscalers (i.e. Amazon, Google, Microsoft, and Meta) have compressed significantly over the past few years.
Some suggest that the group is starting to look like interesting longs. Google is the cheapest on near-term multiples, but it has its own idiosyncratic issues. However, one key assumption supporting these optically cheap multiples is that these companies’ depreciation policies are kosher.
Critics argue otherwise.
Capital intensity is growing rapidly. Google has gone from CapEx accounting for ~10% of revenue in 2021 to ~16% on a LTM basis. Over the same period, Meta has gone from ~16% to ~26% and Microsoft is ~12% to ~23%. Amazon’s capital intensity has barely grown, from ~13% to ~14% in the same period but the mix of its CapEx has shifted dramatically to data centers. The change in depreciation policies are as follows:

Source: Respective company filings
What’s the driver? The AI capex boom, of course. Hence, if you own the hyperscalers because they seem cheap, you are making the assumption that their view of the useful life of datacenter GPUs is reflective of reality. Otherwise, their multiples are understated and their earnings are overstated and the accounting wizards at Amazon et. al are pulling a fast one on investors.
Will The Real Useful Life Please Stand Up?
This is not mere accounting arcana. It is a big deal. It drives demand for (mostly) Nvidia datacenter GPUs as it affects customer ROI. Depending on the real useful life, customer ROI can be starkly negative or exceedingly profitable, and their depreciation policies can be anywhere across the spectrum of aggressiveness and conservatism. This has follow-on effects on the consequent future demand for datacenter GPUs and the state of the AI cycle.
Skeptics argue for a 2-year useful life. They use the timing of Nvidia releases as justification. Ampere was launched in 2020. Hopper was introduced in 2022. Blackwell, the current generation, was introduced in 2024. Rubin is expected to be introduced in 2026. So, a 2-year cadence. Maybe 1 year post-Blackwell if you trust Jensen’s comments during GTC 2025.

Source: Respective company filings
If the hyperscalers had to depreciate the relevant server and network assets over 2 years, as implied by current Nvidia product cadence, they would have to recognize incremental depreciation ranging from 7%-22% of their 2024 EBITDA.1 Not a huge deal for Amazon, but very material for the rest.
In reality, the impact would likely be slightly less as the implicit assumption here (other than assuming server useful life is 2 years) is that network equipment also has a 2 year useful life, which is unlikely to be true. Routers, switches, and other network equipment don’t typically require the most advanced chips, and hence their product cadence and replacement cycle is likely meaningfully longer. Regardless, the incremental depreciation would remain substantial.
So how long do datacenter GPUs last anyway?
If the skeptics are right, we would expect to see prior generation GPUs being worthless, having minimal economic value for resale or rent. Investors should then adjust hyperscalers’ earnings downwards and rethink their view of the cheapness of these companies, especially considering the “ROI on AI capex” implications such a conclusion would imply. If prior generation GPUs aren’t worthless, we need to understand the factors driving that value.
As it turns out, legacy GPUs aren’t worthless.

Source: Camelcamelcamel2

Source: Camelcamelcamel3

Source: Camelcamelcamel4
Due to the limitations of data on the secondary market, the reader will notice that the price histories are of specific SKUs and do not represent the pricing for the respective entirety of that family of GPUs. Each generation of GPUs will generally have multiple SKUs with differing features, such as different memory amounts (16GB, 32GB, 40GB, etc), different form factors (PCIe vs SXM, PCIe 3.0 vs PCIe 4.0, etc), etc. Pricing can also vary due to many factors, such as condition (new, used, refurbished, etc), seller location (impacting shipping costs), seller reputation, etc. I would also caveat reading too much into price spikes over a short period and advise focusing on the general trend. The charts presented are meant to be illustrative.
The above charts (note the varying time periods due to launch timing) show the prices of prior generation Nvidia datacenter GPUs on one secondary / resale market. These GPUs belong to the Turing, Volta, and Ampere generations of Nvidia datacenter GPUs, which entered production 5-8 years ago. For reference, the Hopper family (e.g. H100/200s) were launched 2-3 years ago. Blackwell is ramping high-volume production right now.
While the T4, V100, and A100 have clearly lost value since their launch, the depreciation is not uniform. They can experience periods of appreciation (notably the A100 saw an increase in resale pricing in early 2024, coinciding with the rapid consumer adoption of LLMs) but the general trend in resale value is downwards. Importantly however, resale values seem to stabilize at a certain point (note the T4 price chart shows stabilization at the $700-$800 range and the A100 resale value being in a relatively narrow band throughout most of 2023) suggesting that depreciation curves have flattened substantially.
Why is this the case?
Prior generation GPUs, while not the latest and greatest, often retain their utility. The T4 is valued for its low power consumption, small form factor, and acceptable inference performance, making it suitable for edge deployments, video transcoding, entry-level graphics workstations, and inference use cases where power and space are constrained. The V100 is similarly useful for less computationally demanding AI or HPC tasks, and its inference performance is good for certain budget-sensitive inference workloads not needing the best performance. The A100 is suitable for large model training, especially for markets which are under export restrictions (primarily China). Export restrictions have artificially limited supply and is partly a driver of strong resale values for the A100. Enterprises who are not hyperscalers also prefer the A100 for internal model training.
Importantly, the resale market is not a trivial market. While I used Amazon price histories to illustrate, there exists an entire ecosystem of companies that facilitates the resale of datacenter GPUs. Companies like Procurri and Bitpro are known as IT Asset Disposition (“ITAD”) vendors, which specialize in the acquisition, testing, and resale of used GPUs that are sold to them by hyperscalers and large enterprises. There are many resellers operating on platforms like Amazon, eBay, and Alibaba. Buyers of legacy GPUs are often smaller enterprises, research institutions, and startups who often do not need the newest GPUs as legacy GPUs suffice for their use cases.
Another strong indicator that legacy GPUs do still have value is the rental market. Google Cloud launched T4 in beta in 2019 for $0.95/GPU/hr and Vast is showing $0.15/GPU/hr currently.56 Google Cloud launched V100s in beta in 2018 at $2.48/GPU/hr for on-demand virtual machines in US regions and Lambda current’s spot pricing is $0.55/GPU/hr.78 AWS launched A100 p4d.24xlarge instances (8x A100 40GB) in 2020 at $4.10/GPU/hr and Lambda is offering $1.29/GPU/hr currently.910
Notably, the hyperscalers do not seem to have lowered their pricing for certain GPUs since launch. Google, for example, still has V100s at $2.48/GPU/hr.1112 This is not entirely surprising. The hyperscalers have been supply constrained for many quarters now.
Worth noting is that the lower rental pricing primarily comes from the specialized GPUaaS (GPU-as-a-Service) providers such as Lambda. This is because the hyperscalers generally provide more value compared to GPUaaS providers, as they generally have an extensive ecosystem that includes pre-configured software environments (e.g. AWS Deep Learning AMIs) which bundle drivers, libraries (e.g. CUDA) and ML frameworks (e.g. TensorFlow, PyTorch), and also offer storage solutions (e.g. Amazon S3), networking (e.g. AWS EFA) and managed MLOps platforms (e.g. Amazon Sagemaker) which reduces setup time and overall complexity while improving productivity and efficiency.
In essence, hyperscalers sell a platform, while (most) GPUaaS providers sell compute hours, which explains why the former is competitive with the latter despite higher rental rates. Also note GPU rental pricing can vary regionally due to differing energy costs, data center construction costs, local labor rates, taxes, competitive intensity, etc. But generally, US GPU rental prices are consistently lower than Europe and Asia-Pacific.13 The fact that there remains a robust rental market (note continuous whining by hyperscalers regarding capacity constraints) for legacy GPUs further imply old models are still economically valuable.
To drive the point further, below are illustrative unit economics for the T4 and V100 based on current hyperscalers’ rental pricing.
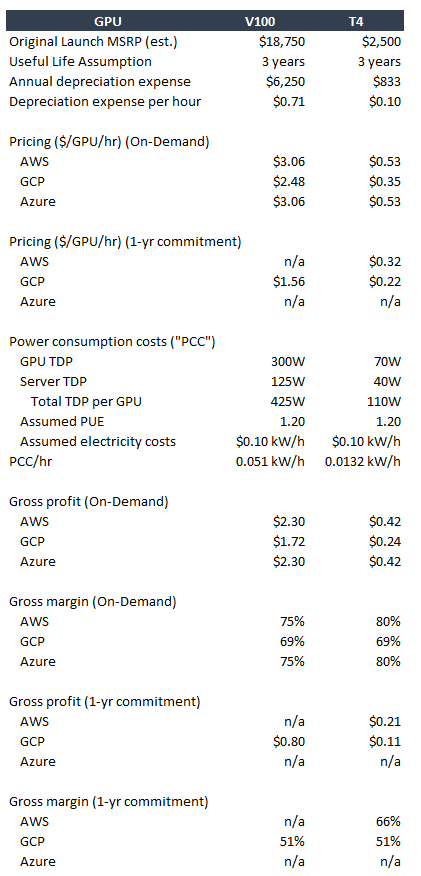
Source: Google Cloud,14 Amazon Web Services,15 GetDeploying,1617 Statista18
Assumed V100 is SXM form factor which has higher TDP at 300W vs 250W for PCIe. 8x V100 16GB SXM in an Nvidia DGX-1 estimated original MSRP of $150k.
A couple points on the assumptions:
a 3-year useful life assumption is significantly shorter than what the hyperscalers currently assume, and this is intentional to show how unit economics pan out even with higher depreciation;
further, most of the T4s and V100s that the hyperscalers have on hand are likely already fully depreciated;
a 3-year useful life is also appropriate to approximate the useful life of a highly utilized GPU;
despite the shorter useful life, the gross profit dollars generated by high utilization more than offsets depreciation
I have assumed a PUE19 of 1.20 which is conservative as the hyperscalers often have PUE below that figure (e.g. Amazon reported a global PUE of 1.15 in 2023,20 with its best-performing data center at 1.04) thus likely overstating power consumption costs, and
I have assumed a $0.10 kW/h electricity pricing. U.S. industrial electricity prices are likely closer to $0.08 kW/h, and hyperscalers can often negotiate meaningfully lower rates.
The key takeaway is that legacy GPUs can still generate very attractive unit economics. Importantly, the above analysis does not consider utilization rates and omits costs such as server overhead (besides the power consumption portion), networking costs, corporate G&A, rental, maintenance, etc.
For the former, the hyperscalers have repeatedly commented on their capacity constraints and hence I would think utilization rates are fairly healthy, though unlikely to be 80%+. Note that the largest cost is depreciation. Once a GPU is fully depreciated, even modest utilization can drive acceptable unit economics.
For the latter, based on CoreWeave’s disclosures, assuming 35% of revenue for these other costs seems reasonable, which would imply fairly attractive operating margins based on the above estimates.21 As CoreWeave is sub-scale relative to the hyperscalers, hyperscalers’ costs are probably lower.
Conclusion
Legacy GPUs remain economically valuable for years. This stems from their utility for less demanding tasks, specific use cases like edge deployments and inference, and regional market demands. The existence of a robust resale ecosystem of ITAD vendors and various resellers, continued demand in the rental market, and strong unit economics based on current spot pricing, indicates that these legacy GPUs are far from worthless. This largely falsifies the hypothesis that a replacement cycle based on new releases defines their true useful life. Thus, the depreciation policies of the hyperscalers may not be as aggressive as some investors suggest. This analysis also suggests that the hyperscalers’ ROI on AI capex may be more profitable than some believe.
Note that Microsoft’s gross PP&E numbers are as of the most recent quarter and its EBITDA numbers are as of LTM. This is because Microsoft’s fiscal year end is in June whereas the others are using a December fiscal year end.
https://camelcamelcamel.com/product/B07QF9MJFR?context=search&cpf=new-used
https://camelcamelcamel.com/product/B07JVNHFFX?context=search&tp=all&cpf=new-used
https://camelcamelcamel.com/product/B0BGZJ27SL?cpf=new-used
https://cloud.google.com/blog/products/ai-machine-learning/nvidia-tesla-t4-gpus-now-available-in-beta
https://vast.ai/pricing/gpu/TESLA-T4
https://www.hpcwire.com/2018/04/30/google-cloud-debuts-v100-gpus/
https://lambda.ai/service/gpu-cloud/pricing
https://aws.amazon.com/ec2/instance-types/p4/
https://lambda.ai/service/gpu-cloud/pricing
https://cloud.google.com/compute/gpus-pricing?hl=en
However, the hyperscalers generally have lower rental pricing if customers commit to longer-term contracts, where rental pricing can be anywhere from 30-50%+ cheaper compared to on-demand. This makes sense for the hyperscaler because while they are giving price concessions, they are getting higher GPU utilization as an offset. Depending on the price disparity between on-demand and committed use, a hyperscaler could make more gross profit with a 50% cheaper pricing with 80% utilization compared to on-demand pricing at 20% utilization.
https://instances.vantage.sh/aws/ec2/p4d.24xlarge?region=ap-southeast-1&os=linux&cost_duration=hourly&reserved_term=Standard.noUpfront
https://cloud.google.com/compute/gpus-pricing
https://aws.amazon.com/ec2/instance-types/g4/
https://getdeploying.com/reference/cloud-gpu/nvidia-v100
https://getdeploying.com/reference/cloud-gpu/nvidia-t4
https://www.statista.com/statistics/190680/us-industrial-consumer-price-estimates-for-retail-electricity-since-1970/
Power Usage Effectiveness (PUE) is an industry standard metric to measure data center energy efficiency. It is calculated by dividing the total power entering the data center by the power used by IT equipment. Lower is better; a lower quotient approaching 1.0 indicates greater efficiency.
https://www.datacenterdynamics.com/en/news/aws-global-data-centers-achieved-pue-of-115-in-2023/
Note that CoreWeave records depreciation in “technology and infrastructure expense” rather than cost of revenue as I show in this example. Hence CoreWeave’s non-depreciation costs would amount to 1) the portion of technology and infrastructure costs not allocated to depreciation, 2) cost of revenue, 3) sales and marketing, and 4) general and administrative costs. In total, these amounted to roughly 35% in 2024.
Disclaimer: The author's reports contain factual statements and opinions. The author derives factual statements from sources which he believes are accurate, but neither they nor the author represent that the facts presented are accurate or complete. Opinions are those of the author and are subject to change without notice. His reports are for informational purposes only and do not offer securities or solicit the offer of securities of any company. The author accepts no liability whatsoever for any direct or consequential loss or damage arising from any use of his reports or their content. The author advises readers to conduct their own due diligence before investing in any companies covered by him. He does not know of each individual's investment objectives, risk appetite, and time horizon. His reports do not constitute as investment advice and are meant for general public consumption. Past performance is not indicative of future performance.