

Ryanair: It's (Capacity) Crunch Time
Ryanair's multi-year growth and capital-return story is supported by partnerships with OTAs, supply tightness, potential delivery deferrals, and lower competitive intensity on capacity.


Ryanair is stunningly cheap, potentially trading at 20%+ FY2028 FCF yields or <5x EV/ FY2028 FCF, with FY2028 cash likely accounting for ~40% of its current market cap.1 Said another way, Ryanair is a triple in 3 years if it gets valued at ~15x EV/FCF.
The critical debate hinges on recent pricing headwinds which drove substantial (~60%) downward revisions to near-term EPS throughout 2024 and share price declines. While recent near-term EPS revisions have been upwards, they remain significantly (~35%) below peak EPS estimates in 2024.
In my view, said headwinds are a temporary disruption to a compelling multi-year growth and capital-return story. In a nutshell, the confluence of several factors, 1) Ryanair partnerships with OTAs, 2) supply tightness which is likely to persist for several years, 3) the current tariff situation potentially leading to delivery deferrals, and 4) continued financial conservatism by the largest airlines driving lower competitive intensity on capacity are likely to drive multi-year pricing tailwinds. Importantly, these factors represent yet another step towards the endgame of a consolidated European aviation industry with rational competition and long-term pricing power.
Why does the opportunity exist? After coming off two years of double-digit fare increases (FY23: +10% vs pre-Covid, FY24: +21% YoY), Ryanair shocked investors in Q1 FY25 (Q2 CY24) by reporting that revenue per pax declined 10% YoY, driven by 15% lower average fares and 10% growth in passengers.2 This was a dramatic downside surprise as management has been touting supply tightness and its consequent positive impact on fares, raising questions as to the veracity of their claims. Instead of management misreading supply tightness, I believe the main reason for pricing headwinds are Ryanair’s OTA initiatives over the past few years.
Ryanair has been in legal disputes with several OTAs, such as Booking.com, Kiwi.com, and eDreams, amongst others, accusing them of illegal screen-scraping of Ryanair’s tickets and overcharging consumers. The company has alleged that these OTAs have overcharged consumers as much as 3 times Ryanair’s original pricing.345 Thus, Ryanair began removing such “unauthorized” flights in early Dec 2023. Management expected load factors for Dec 2023 and Jan 2024 to be cut 1-2% and softer yields in Q4 FY24 as a result.6 This expectation seemed to match actuals:

Source: Ryanair. Note fiscal year ends in March; FY24 corresponds to the 12-month period ended March 2024.
They then proceeded to report the aforementioned Q1 FY25 quarter where average fares declined 15% year-over-year and another 7% in Q2 FY25. In my view, management severely under-estimated the impact of OTA bookings on its business.
Consumers typically book short-haul flights anywhere from 2-6 months in advance, and hence the impact of any removal of demand is likely to be felt roughly 2 quarters after. Furthermore, airlines make most of their money during the spring and summer as those are peak travel periods. Hence, the real test of the impact of Ryanair’s OTA initiatives would be H1 FY25 as we have seen, not Q3/Q4 FY24. Q4 FY24 also had the benefit of the first half of Easter falling during that quarter. The reason why the declines in average fares in Q1/Q2 FY25 were so dramatic is because these OTAs historically accounted for 10-15% of Ryanair’s volume.7
Why now? Since then, Ryanair has come to agreements with several OTAs (“Partnered OTAs”), including Expedia, Kiwi, Trip.com, among others, where said OTAs promise not to overcharge Ryanair consumers and in return Ryanair gives them access to their capacity.8910 Major OTAs who haven’t yet partnered with Ryanair include Booking.com and eDreams. I estimate that these non-partnered OTAs likely accounted for 3-5% of Ryanair’s volume. The rate of change in average fares have improved materially, stabilizing at +1% YoY in Q3 FY25. This is unsurprising as OTA traffic is being progressively restored as said OTA agreements get signed.
I expect average fares to continue to increase going forward. The primary driver is supply tightness, which is likely to persist for several years. The critical factors determining supply tightness are 1) enormous OEM order books, 2) Pratt & Whitney GTF engine issues, and 3) the dramatic decline in competitive intensity on capacity expansion.

Source: Data as of mid-April 2025. Boeing Commercial Orders & Deliveries,11 Airbus Commercial Orders & Deliveries12
Based on the above, at an average of 2023-2024 delivery rates, Boeing and Airbus would take roughly 13 years and 7 years respectively to clear the current backlog, assuming no new orders or cancellations. Boeing has been experiencing significant production issues over the past few years, notably the IAM strike in 2024 and legacy 737 MAX issues, resulting in suppressed production. They expect to be at 38 and 7 units per month for the 737 and 787 respectively, which are the main production models, representing a 540 annual run-rate. Boeing management has noted that this has room to increase further depending on FAA approvals, so normalized production could be something like 600 per annum, which would lower the prior 13 years backlog clearance estimate to roughly 9 years. For reference, there are about 25,000 commercial aircraft in operation globally today, and at a rough 1,300 annual delivery run-rate from Airbus and Boeing, and given ~40% of deliveries are for fleet replacement, net supply growth is ~3% per annum compared to 4% historical passenger traffic CAGR.13 Furthermore, given OEMs have been producing far below schedules given in 2018, there is likely a >3,200 aircraft shortage built over the past several years, representing >13% of the current global fleet.

Source: AerCap Baird Global Industrial Conference 202414
This global aircraft shortage has been compounded by Pratt & Whitney GTF engine issues affecting the A320neo (engines are dual-sourced: PW1100G / CFM’s LEAP-1A). Essentially, P&W discovered contaminated powdered metal was used in production of some engine parts and has since recalled all 3,000 PW1100G engines in operation. This issue is also a reason why Airbus production rates have struggled. Almost 700 GTF-powered jets are in storage, with the vast majority being grounded due to said issue which is expected to last through 2026.15 This increases the global aircraft shortage to >3,900 aircraft, or nearly 16% of the current global fleet.

The extent of supply tightness is apparent when looking at passenger traffic for European carriers. Year-to-date through 4/17, average daily flights remain 3% under pre-COVID levels, Notably, of the top 10 operators which account for ~42% of average daily flights, Lufthansa, Air France, easyJet, British Airways, and SAS are between ~10%-30% under 2019 levels, with Wizz, Ryanair, and Turkish being the material capacity and market share gainers since the COVID crisis.
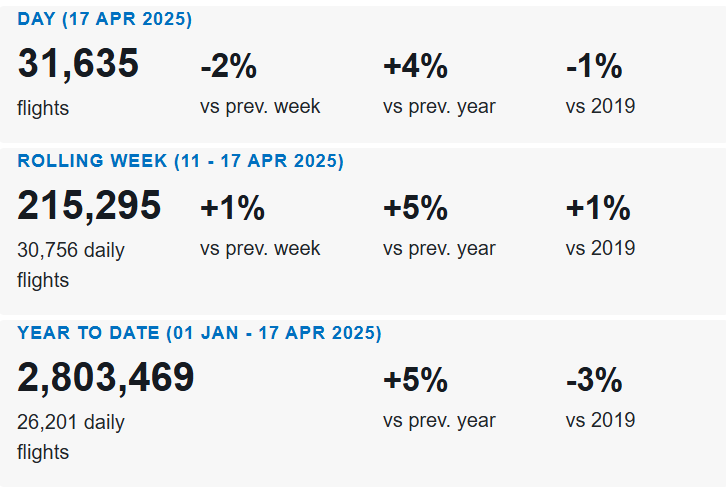
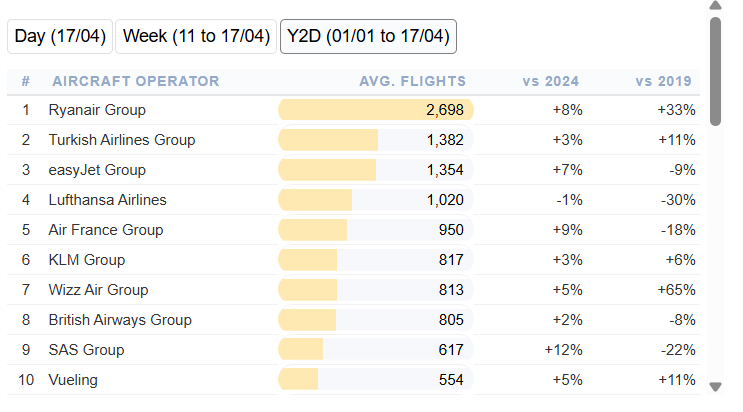
Source: Eurocontrol, Data as of 4/17/25
European capacity is also unlikely to expand significantly going forward. The main reasons are the current trade war and the need for financial conservatism driving competitive intensity on capacity dramatically lower.
In my view, it is quite possible we see substantial aircraft delivery deferrals over the next few quarters if the current tariffs rates (up to 245% on China, imposed by the US) hold. Tariffs are not new to the industry. The US and EU have a long history of aircraft trade disputes that resulted in WTO rulings and the imposition of bilateral tariffs, the latter of which was eventually suspended for 5 years.

Source: Various Airbus, Intereconomics, European Commission, and Washington International Trade Association press releases.
The key question on tariffs is how the industry will respond. Standard aircraft purchase agreements (“APAs”) include price escalation clauses (due to lead times in manufacturing spanning years from initial order to delivery) to protect OEMs from inflation in labor, materials, and other manufacturing costs. These are typically linked to labor rate indices and industrial commodity price indices. Base prices are agreed at contract signing, and escalation formulas are applied periodically or at delivery to determine final prices.
Importantly, such price escalation clauses are primarily designed to account for inflation in OEM-specific costs over a long period, and are generally not structured to account for external shocks (i.e. tariffs) and hence unlikely to be the primary remedy for tariff imposition. Other relevant clauses are delivery flexibility, and force majeure, though the latter is generally a difficult argument to make, leaving delivery flexibility as the likely remedy.
Delivery flexibility clauses allow for deferral, substitution or cancellation under certain conditions, and deferral is generally the preferred option as it allows both parties to retain the most flexibility; substitution is tough with massive order backlogs, and cancellation would result in OEM supply chain disruption as well as disruption in airline capacity planning.
OEMs could also see production delays as they may postpone the purchase of production materials and parts with the view that current tariffs are unlikely to persist, further driving supply tightness. This problem would be concentrated at Boeing. >10,000 Boeing airplanes have China-made parts, and Boeing has $1.5 billion in China costs annually.16

Source: Data compiled from various individual company press releases, presentations, etc.
Prior to the current tariff situation, net fleet growth trends were already slowing substantially, especially at the largest European carriers, notably Lufthansa, IAG, and easyJet. Of the flag carriers, only AF-KLM has been expanding its fleet at an accelerating pace, but it hasn’t translated to actual capacity increases; their average daily flights is still down 9% vs 2019. The notable airlines with substantial fleet growth that have driven actual increases are Wizz and Ryanair, and despite their growth, EU capacity remains slightly below 2019 levels, as discussed previously.
In my view, these fleet growth trends driving supply tightness are likely to persist, not only due to tariffs, but because European carriers have become significantly more financially conservative post-COVID, which is likely to materialize in dramatically lower competitive intensity relating to capacity.
The legacy network carriers, Lufthansa Group, Air France-KLM, and IAG, faced an existential threat during the pandemic due to their higher fixed costs, reliance on complex hub-and-spoke networks, and significant exposure to the collapsed long-haul and business travel markets. Survival necessitated substantial government support, primarily through state-backed loans, guarantees, and direct equity injections. While crucial for liquidity, this aid significantly increased debt levels and often came with implicit or explicit conditions, influencing subsequent strategic decisions. Consequently, as the recovery began, these carriers prioritized balance sheet repair and deleveraging alongside operational restoration:
Lufthansa lost almost €7 billion in 2020, followed by another €2 billion loss in 2021. The recovery saw a return to profitability in 2022 with a €0.8 billion net profit, strengthening to €1.7 billion in 2023 and €1.4 billion in 2024. This trajectory was underpinned by significant state stabilization packages, which were subsequently repaid. Net debt surged from €6.7 billion pre-pandemic to €9.9 billion at the end of 2020, before being progressively reduced to €5.7 billion by the end of 2023 and held stable at that level by year-end 2024. Aircraft deliveries were deferred to reduce CapEx significantly in 2020 and 2021. Management emphasized financial stability, cost efficiency programs as key priorities post-crisis.
Air France-KLM started with losing over €7 billion in 2020 and continuing with a €3.3 billion loss in 2021. The group returned to profitability in 2022 with a €0.7 billion net profit, followed by €0.9 billion in 2023 and €300 million in 2024. Similar to Lufthansa, AF-KLM’s survival was heavily dependent on substantial state aid packages from both the French (€7 billion) and Dutch (€3.4 billion) governments. These necessitated subsequent recapitalization efforts and, although eventually repaid, contributed to a significant increase in debt. Net debt peaked above €11 billion in 2020 before being reduced to €5.0 billion by the end of 2023. However, net debt rose again to €7.4 billion by the end of 2024, causing management to initiate a restructuring program to improve profitability and repair its balance sheet. Management has also noted their focus on fleet rationalization (replacing older aircraft with newer, more efficient aircraft) rather than fleet growth.
IAG fared the best of the legacy network carriers. Despite losing nearly €7 billion in 2020 and €3 billion in 2021, the upcycle post-lockdowns helped the company report a strong recovery in profits, making €400 million in 2022, and €2.7 billion in both 2023 and 2024. To navigate the crisis, IAG executed a €2.75 billion rights issue in late 2020, significantly bolstering liquidity and strengthening the balance sheet. Net debt peaked at €11.7 billion at the end of 2021 but was progressively reduced through strong cash flow generation, falling to €7.5 billion by end-2024. The pandemic forced immediate and significant fleet rationalization. British Airways retired its entire 747 fleet, and Iberia phased out its A340-600s. These actions were driven by the collapse in long-haul demand and the high operating costs of these aircraft. Concurrently, IAG deferred 68 aircraft deliveries scheduled for 2020-2022 to conserve cash. As financial performance recovered, IAG resumed investments in fleet modernization, similar to AF-KLM.
The uncertainty on the legality of state aid is also likely to result in caution from European national carriers. In response to the pandemic, European governments, facilitated by the European Commission's flexible COVID-19 Temporary Framework adopted in March 2020, deployed state aid on a massive scale. Tens of billions were approved or granted through various instruments, including state-backed loans, guarantees, direct grants, and recapitalizations involving equity injections.
State aid distribution within the EU was heavily unbalanced, with major member states like Germany, France, Italy, and Spain providing the majority of the support. This aid was largely focused on their respective national airlines, including Lufthansa Group, Air France-KLM, Alitalia/ITA Airways, SAS, and TAP Air Portugal. This unequal distribution led to legal challenges, primarily from Ryanair, which argued that the aid created an unfair competitive landscape and violated EU non-discrimination principles.
These challenges led to numerous annulments of Commission approval decisions by the EU General Court, though some were subsequently reapproved after terms were adjusted.17 The Court frequently cited procedural errors, inadequate assessments of market power and competitive effects, failure to correctly identify beneficiaries within airline groups (especially in the Air France-KLM cases; see judgements T-643/20, T-216/21, T-494/21, and T-146/22), and insufficient mechanisms to incentivize state exit or ensure proportionate burden-sharing. Importantly, these legal challenges are still ongoing; for example, state aid awarded to Lufthansa was annulled in May 2023 (T-34/21, T-87/21) and the company is appealing the annulment. Such uncertainty is likely to result in further caution by the aforementioned national carriers.
The pandemic and subsequent government aid sped up industry consolidation. Low-cost carriers (LCCs), especially Ryanair and Wizz Air, were not burdened by state aid and could quickly restore capacity and grow market share. Legacy carriers, slowed down by restructuring and legal battles tied to aid, recovered capacity more slowly. The crisis also drove consolidation. Air France-KLM invested in the restructured SAS, and Lufthansa Group acquired a stake in ITA Airways, due to the financial weakening of carriers like SAS and Alitalia/ITA.
What can pricing look like? Illustratively, modeling a 1% increase in average passenger fares for Q4 FY25 (vs 1% in Q3 FY25, and implying -6% for FY25) and 3% increase thereafter through FY28, a meaningful decline in fuel costs (jet fuel prices have already declined significantly; this impacts Ryanair with a roughly 12-month lag given the company hedges most of its fuel needs 1-2 years out), along with (roughly) consensus assumptions for ancillary revenue growth and non-fuel cost trends, Ryanair would trade at 20%+ 2028 FCF (EBITDA less maintenance CapEx, where the latter is assumed to equal depreciation) yield, with net cash accounting for nearly 40% of the current market cap.18 Said assumptions imply EBIT per passenger in the low-teens, a range which has been repeatedly surpassed historically. I anticipate that Ryanair will use a significant portion of this cash generation for share buybacks, having already repurchased €1.5 billion worth in the last two years.
Importantly, the aforementioned assumptions are illustrative. I don’t pretend to know what the actual pricing figure will be. Instead, I believe there is a strong argument that pricing will be meaningfully positive. Moreover, said assumptions could prove too low, especially given average passenger fares rose 50% and 21% in 2023 and 2024 (with 2023 and 2024 fares representing 111% and 134% of 2019 fares). Naturally, I doubt the upper bound would be similar to 2023/2024 as a % of 2024, given some level of pricing benefit is likely driven by pent-up demand. Given we are a few years out from COVID, the view that pent-up demand is still driving pricing is increasingly unlikely. Furthermore, even if we model steady fares (i.e. 0% increase through 2028) shares would trade at roughly 8% FCF yields. In essence, the distribution of outcomes appears dramatically skewed to the positive.
Appendix
Company overview & competitive advantage: Ryanair is an ultra-low cost carrier (“ULCC”) which provides short-haul commercial air transportation services across Europe. It is the lowest cost operator, with many of its competitors having unit costs ex-fuel ranging from 60% higher to multiples that of the company.

Source: Ryanair
Importantly, the company’s strong cost position is not obtained through favorable fuel hedges (which can flatter costs), exceeding low fleet age (maintenance costs start to really ramp up when it is time for “D-checks” which occurs at 5-7 years of aircraft age), unusually long estimated useful lives (reducing annual depreciation) and/or large salvage values, or extremely long sector lengths (spreading fixed costs over a larger base). Ex-fuel costs as shown are still way ahead of the industry, average fleet age is roughly 9 years, which is significantly older than Wizz’s fleet. The company assumes 23 years for an aircraft's useful life, which is roughly in-line with the industry. Average sector length is much shorter than most competitors given its short-haul focus; this point is also reiterated by the above-shown unit costs ex-fuel, which excludes the impact of sector lengths.
Instead, Ryanair’s low unit costs stems largely from its bare-bones services (just flight and baggage), nearly uniform aircraft fleet (mostly Boeing 737s), large secondary airport exposure (where Ryanair can be a very large proportion of said airport’s capacity, allowing it to negotiate very favorable rates), and economies of scale in aircraft purchasing (large orders allow the company to negotiate significant discounts; notably, Ryanair tends to book orders during periods of crisis; 9/11, 2008 financial crisis, Gulf War, COVID, etc, often enabling a “double-discount”; I estimate it probably got a ~60% discount on its recent 300 Boeing Max-10 order, based on management’s 2027-2033 capex guide).19
Given the wide disparity in operating costs, it is very tough for competitors to replicate Ryanair’s cost structure. Many have gone up-market to more premium passengers, focusing on primary airports (e.g. easyJet) or gone into other markets, avoiding large-scale direct competition against Ryanair (e.g. Wizz). This is likely to be a one-way trend given many of Ryanair’s competitors have unit costs that are at the level of the company’s average passenger fares.
Low unit costs have driven low fares for passengers, though “low” is a relative term given fare increases over the past few years. Ryanair’s approach to pricing flights is load active/yield passive, which essentially means they do not raise prices unless they can hit their load factor targets. Given the aforementioned outlook for supply and Ryanair’s gap in fleet growth post-2027, we should see pricing benefits going forward.
Industry overview: The European airline market comprises several key segments. These include low-cost carriers, legacy or flag carriers, regional airlines that typically operate shorter routes connecting smaller communities, charter airlines focusing on leisure travel packages, and all-cargo operations dedicated to freight transport. The market share distribution among these segments has changed significantly over time, with low-cost carriers becoming increasingly dominant. In 2024, legacy carriers held the largest share at 36%, closely followed by low-cost carriers at 34%, with both segments expanding their share compared to the previous year.20
Total full-year traffic in 2024 showed a strong recovery, rising by 10.4% compared to 2023 and reaching 3.8% above pre-pandemic levels. However, the number of European flights in 2024 was still at 96% of the 2019 levels.21 Strong pent-up leisure demand has been a key driver of growth, particularly for tourism-oriented destinations.22 The European airline industry also experiences significant seasonality in demand, with traffic volumes typically peaking during the summer months.
Ryanair, Wizz Air, and EasyJet have been leading the capacity recovery in Europe, demonstrating their agility and strong position for growth in the current environment. In contrast, the legacy carriers face ongoing challenges in adapting to the intense competition from LCCs and have been undertaking various restructuring efforts to improve their profitability and are shifting their focus largely to fleet modernization rather than fleet growth.
The valuation is even cheaper if you can purchase the ordinary shares, which generally trade at a discount to the ADRs.
https://investor.ryanair.com/wp-content/uploads/2024/07/Q1-FY25-Ryanair-Results.pdf
https://corporate.ryanair.com/news/ryanair-april-survey-exposes-otas-edreams-vola-overcharging-consumers-80-over-ryanair-prices/
https://corporate.ryanair.com/news/ryanair-jan-survey-shows-otas-edreams-vola-booking-com-still-overcharging-consumers-125-over-ryanair-prices/
https://corporate.ryanair.com/news/otas-edreams-vola-booking-com-exposed-again-as-ryanair-mar-survey-shows-consumers-being-overcharged-by-up-to-3-times-ryanair-prices/
https://investor.ryanair.com/wp-content/uploads/2024/01/Ryanair-Q3-FY24-Presentation.pdf
Ryanair’s Q3 FY24 earnings call transcript
https://corporate.ryanair.com/news/ryanair-and-expedia-group-partnership-takes-off/#:~:text=This%20partnership%20also%20enables%20Expedia,lasting%20memory%20for%20our%20travelers.%E2%80%9D
https://corporate.ryanair.com/novetats/ryanair-and-kiwi-partnership-takes-off/
https://corporate.ryanair.com/news/ryanair-announces-approved-ota-partnership-with-trip-com/
https://www.boeing.com/commercial#orders-deliveries
https://www.airbus.com/en/products-services/commercial-aircraft/orders-and-deliveries
Airbus Global Market Forecast 2024-2043 Presentation
https://www.aercap.com/_assets/_935aa3f0e3d9c7ff473503b792857efa/aercap/db/511/13696/presentation/Baird+Global+Industrial+Conference+%28Nov+2024%29_vSPA2.pdf
https://www.flightglobal.com/engines/cfm-pandw-address-durability-issues-as-number-of-grounded-gtf-powered-jets-inches-higher/160356.article
https://investors.boeing.com/investors/news/press-release-details/2024/Boeing-China-Commercial-Fleet-to-More-than-Double-by-2043-for-Growth-and-Modernization/default.aspx
EC case numbers: Lufthansa (SA.57153), Air France (SA.57082, SA.59913), SAS (SA.57543, SA.58342), TAP Air Portugal (SA.57369).
Note that with the 5-2 stock split, 1 ADR represents 2 ordinary shares.
https://investor.ryanair.com/wp-content/uploads/2023/05/Boeing-Final-ppt.-May-2023-.pdf
https://www.eurocontrol.int/sites/default/files/2025-01/eurocontrol-european-aviation-overview-20250123-2024-review.pdf
https://www.eurocontrol.int/sites/default/files/2025-01/eurocontrol-european-aviation-overview-20250123-2024-review.pdf
https://simpleflying.com/thread/european-air-traffic-is-above-pre-pandemic-levels-overall-why-are-some-countries-lagging-behind/
Disclaimer: The author's reports contain factual statements and opinions. The author derives factual statements from sources which he believes are accurate, but neither they nor the author represent that the facts presented are accurate or complete. Opinions are those of the author and are subject to change without notice. His reports are for informational purposes only and do not offer securities or solicit the offer of securities of any company. The author accepts no liability whatsoever for any direct or consequential loss or damage arising from any use of his reports or their content. The author advises readers to conduct their own due diligence before investing in any companies covered by him. He does not know of each individual's investment objectives, risk appetite, and time horizon. His reports do not constitute as investment advice and are meant for general public consumption. Past performance is not indicative of future performance.